![Docker Logs to Splunk [HTTP Event Collector]](/images/write-docker-logs-to-splunk-http-event-collector/Untitled.png)
Introduction
I’ve been bouncing around logging software for a while, and decided to give Splunk a try (over Kibana), so this is a quick tutorial on how to set it up.
Prerequisites
- Splunk instance with IP (Cloud, Local, or Docker — mine is a Docker container at
192.168.68.46:8000) - A Docker container you want to log into Splunk
What is Splunk?
Splunk is used for monitoring and searching through big data. It indexes and correlates information in a container that makes it searchable, and makes it possible to generate alerts, reports and visualizations.
— Cloudian
Essentially it is a place that collects and gathers all your logs from different locations, which allows you to consolidate and search them for specific information.
Target Docker Container
This is out of scope for the tutorial itself, but as an example I have a .NET application using NLog to format output into a consistent, parseable format:
.NET Application Logging Configuration
using NLog.Config;
using NLog.Targets;

namespace Application.Common.Utilities
{
    public class ApplicationLogging
    {
        public static void Initialize()
        {
            var config = new LoggingConfiguration();
            var consoleTarget = new ConsoleTarget
            {
                Name = "console",
                Layout = "${date}|${level:uppercase=true}|${callsite:includeNamespace=false:className=true:methodName=false}|${message}",
            };
            config.AddTarget(consoleTarget);
            config.AddRuleForAllLevels(consoleTarget);
            LogManager.Configuration = config;
            LogManager.GetCurrentClassLogger().Info("Initialized my Logging!");
        }
    }
}
This generates log lines like:
2021/11/01 19:31:31.768|INFO|ApplicationLogging|Initialized my Logging!Following the format: <TIME>|<LOG_LEVEL>|<CALLING_CLASS>|<MESSAGE>
You can use any logger or even plain Console.WriteLine — what matters is a consistent, parseable format.
Splunk Setup
This works with any Splunk instance type (cloud, local, or Docker).
- Navigate to your Splunk Web UI at
http://192.168.68.46:8000(port 8000 is the default web port) - Go to Settings > DATA > Data Inputs
- Click HTTP Event Collector
- Click New Token in the top right corner
- Add a name and description for your collector, click Next
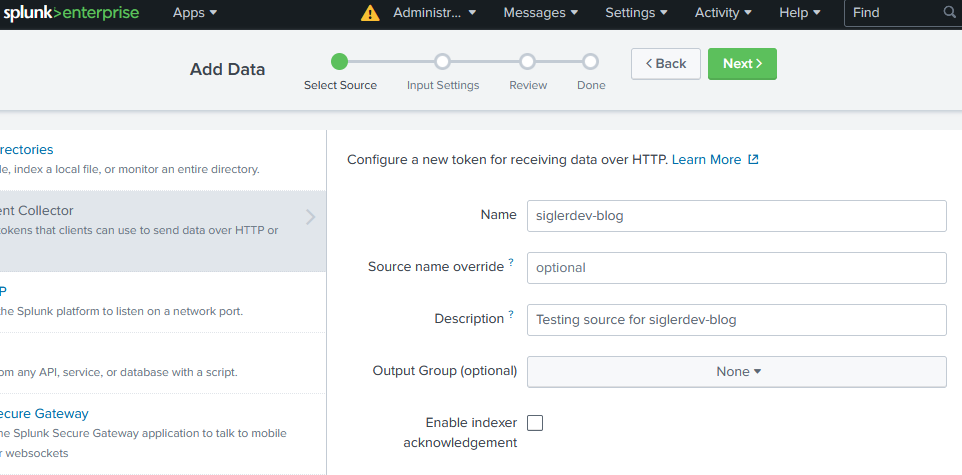
- Click through Next for Input Settings, Review, and Done. Default settings are fine.
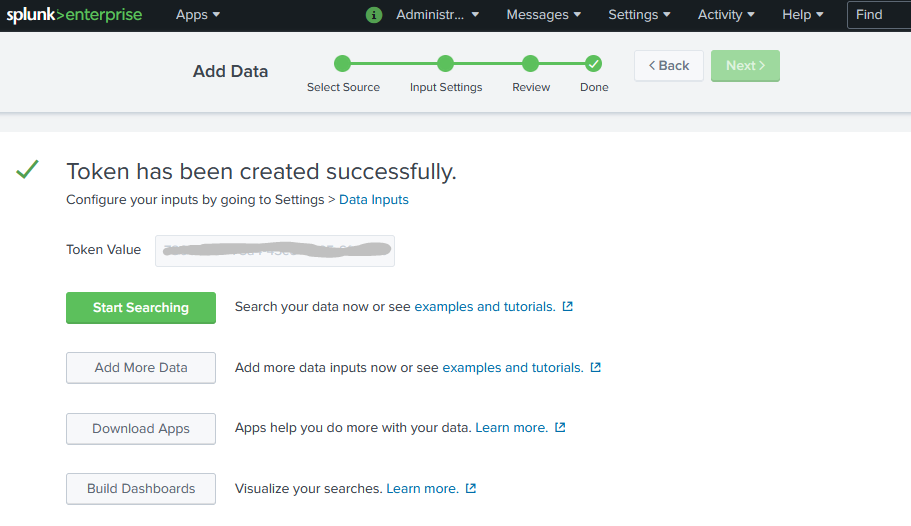
- Save the Token Value shown on the final page — you’ll need it next.
Configure the Docker Container
Add the following arguments to your Docker container (via Compose or CLI):
--log-driver=splunk
--log-opt splunk-token=7fc97e9f-e1o6-4tr2-8d8a-0b51d11f83bd
--log-opt splunk-url=http://192.168.68.46:8088--log-driver=splunk— tells Docker to use the Splunk logging driver--log-opt splunk-token={TOKEN}— the HEC token from the previous step--log-opt splunk-url— your Splunk HEC endpoint (port8088by default, different from the web UI)
Restart your container, then open the Splunk search at http://192.168.68.46:8000/en-US/app/search/search and run:
source="http:siglerdev-blog"
| rex "\{\"line\":\"(?<time>.+)\|(?<log_level>.+)\|(?<Controller>.+)\|(?<Message>.+\}|.+?)\""
| fields - _time
| table time log_level Controller Message
| sort -time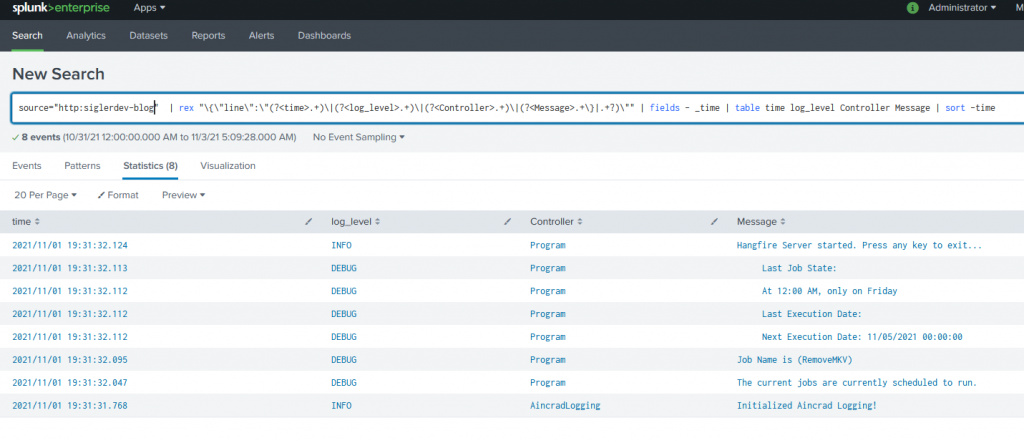
Once you reach this far you can experiment with different query parameters to pull specific information and build dashboards around your log data.
Thank you for reading — let me know below if you have any questions!